|
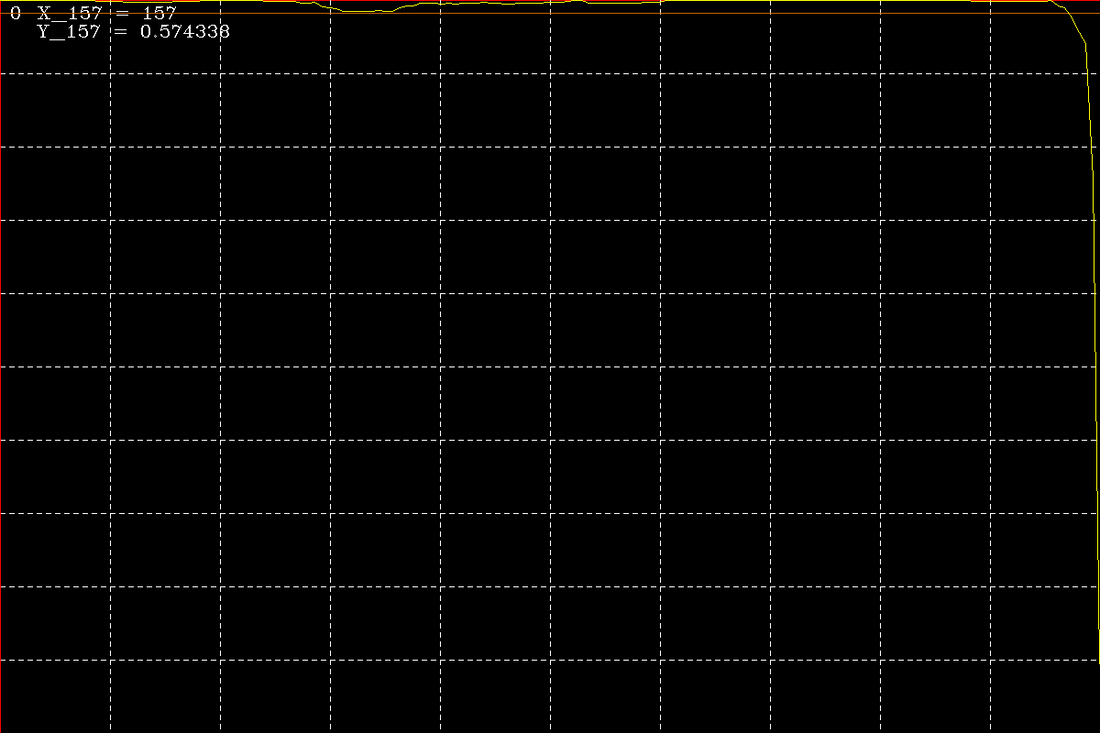
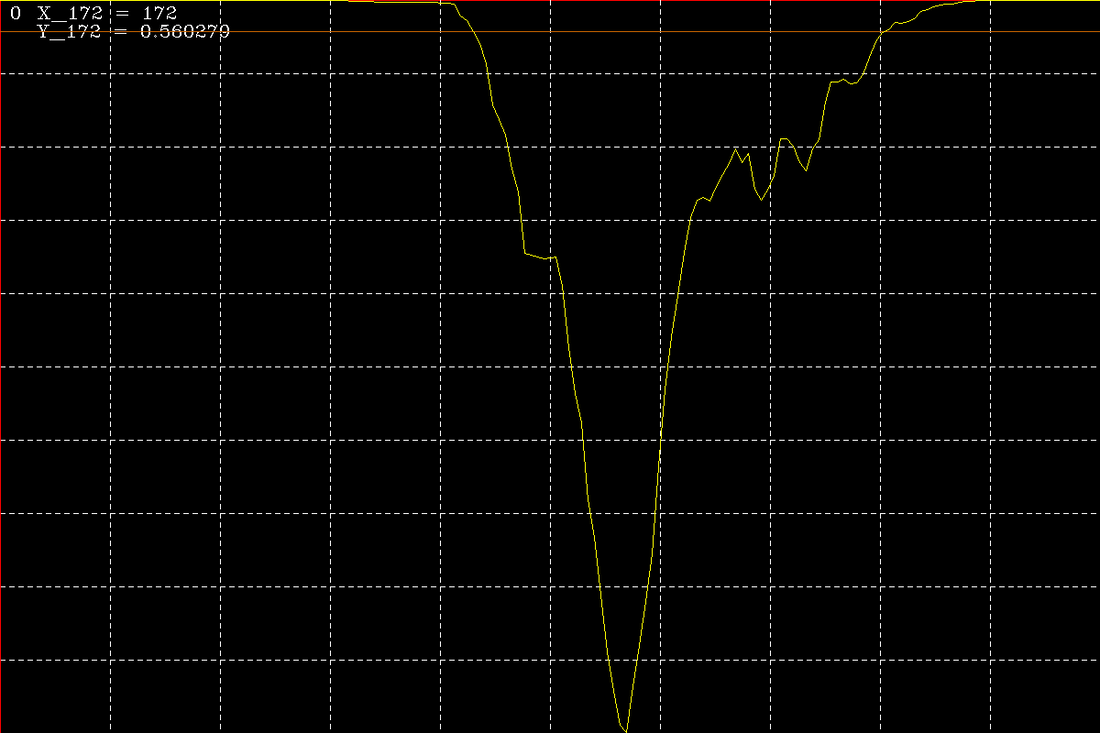
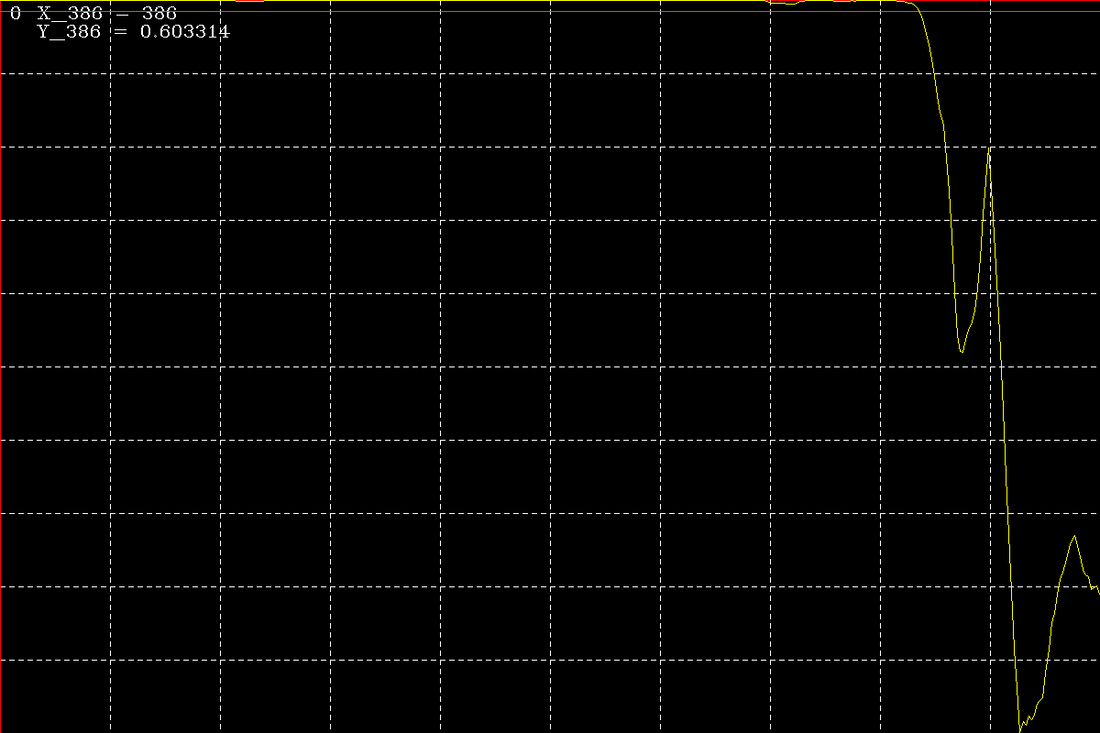
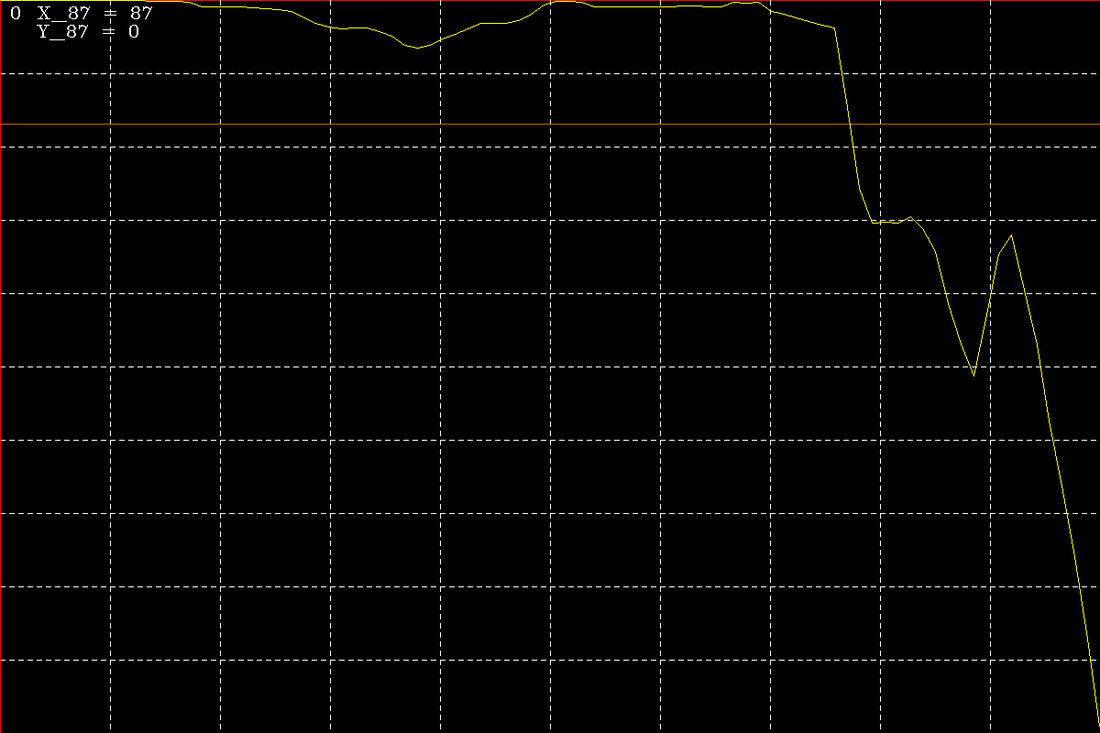
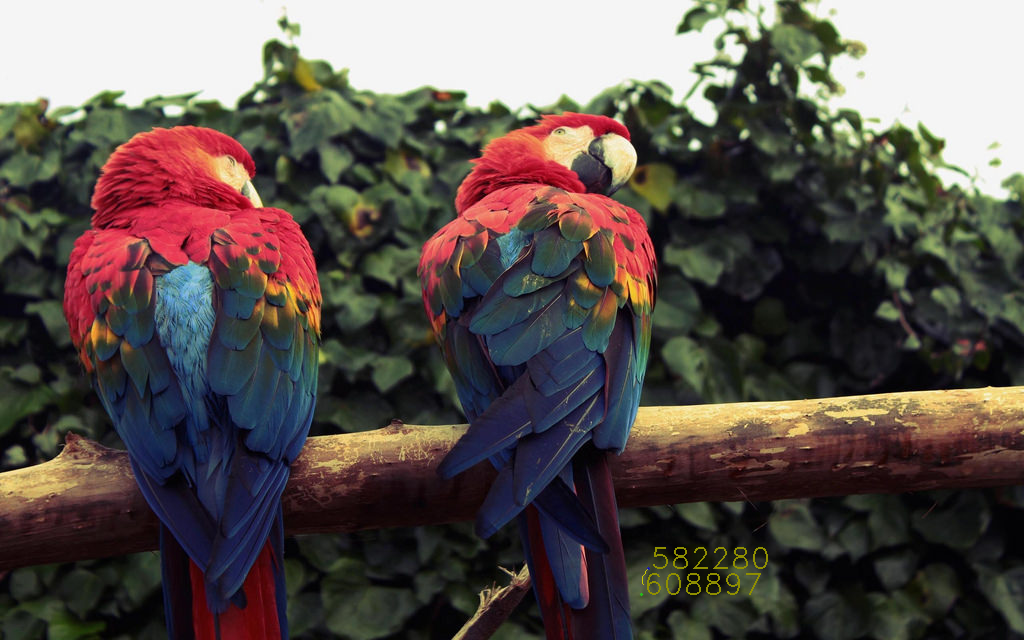
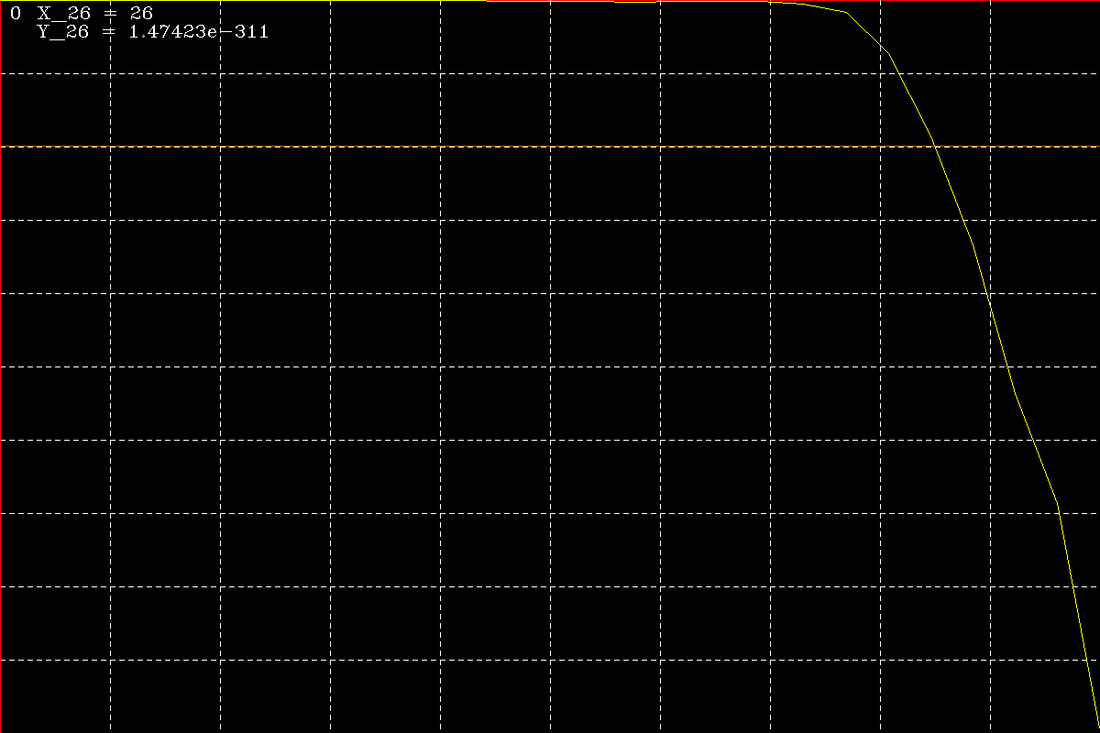
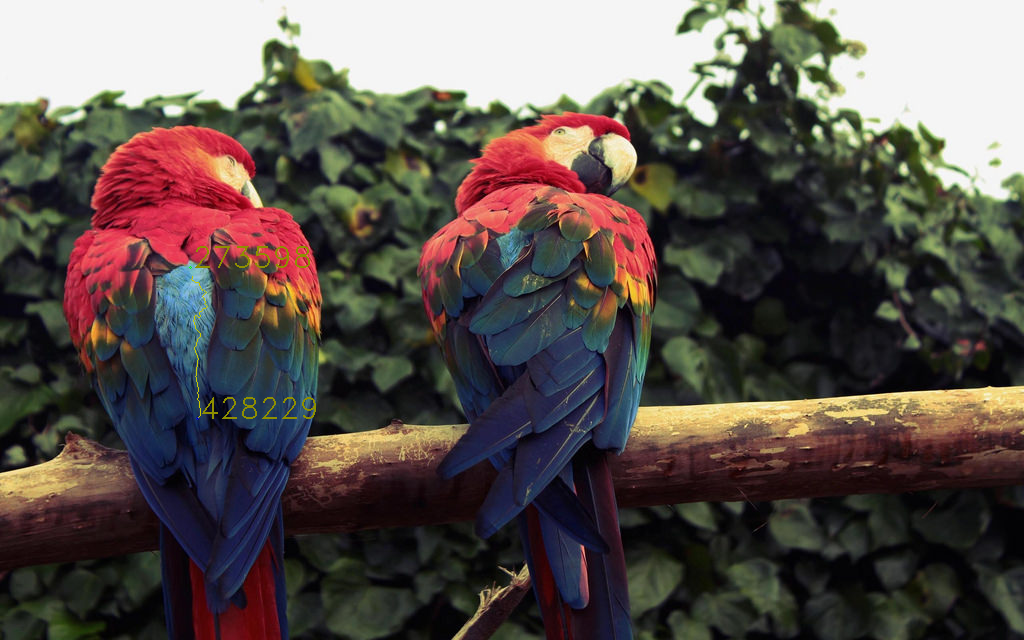
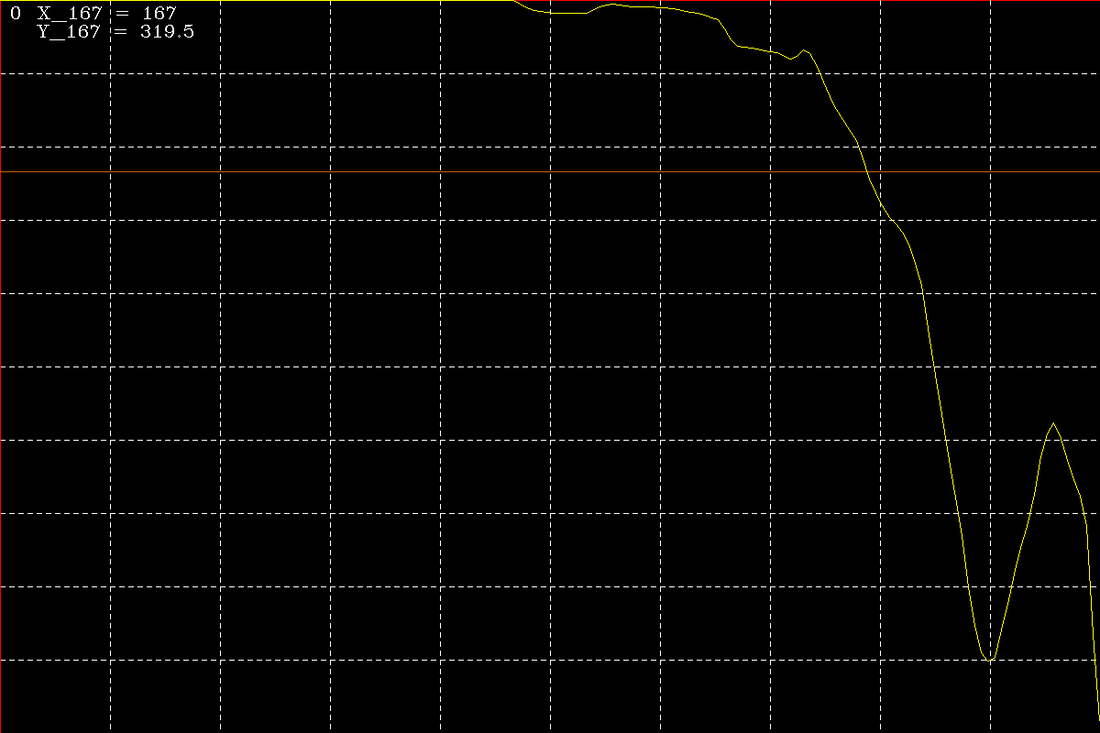
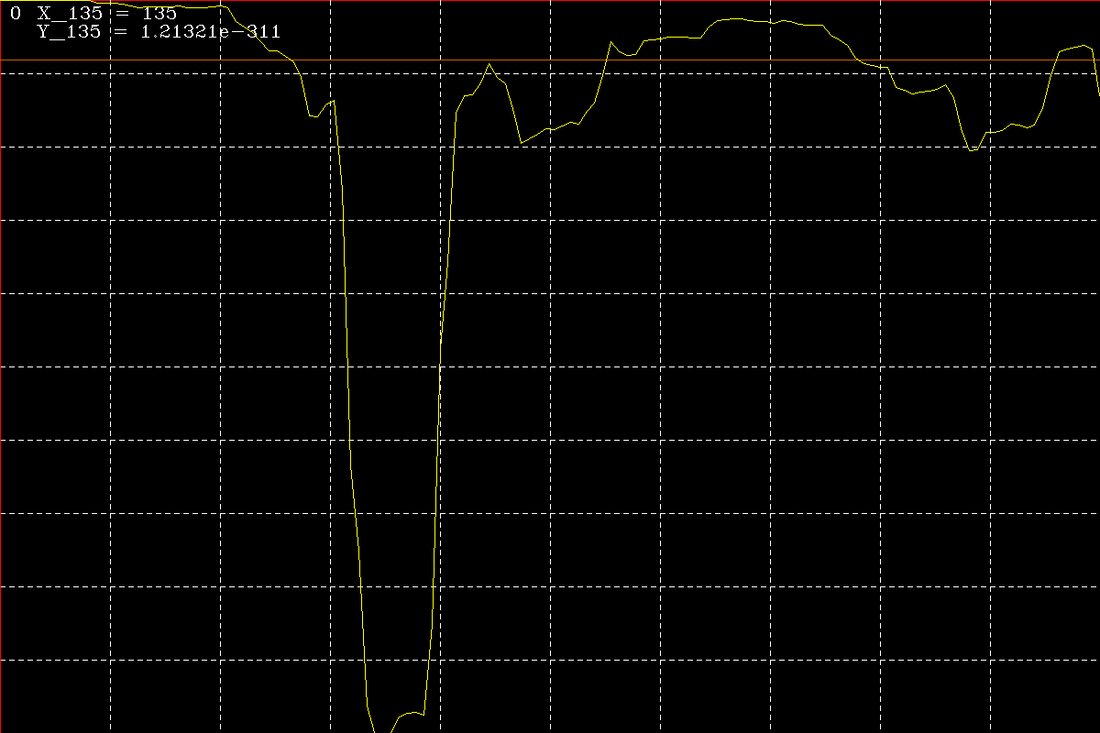
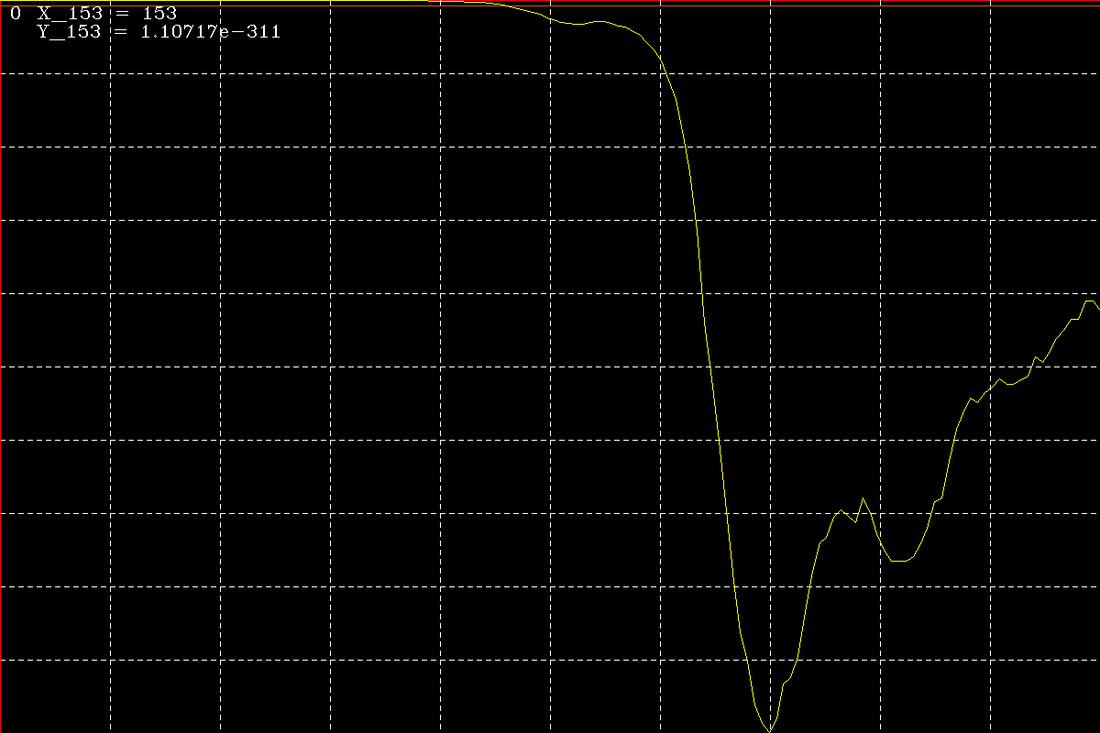
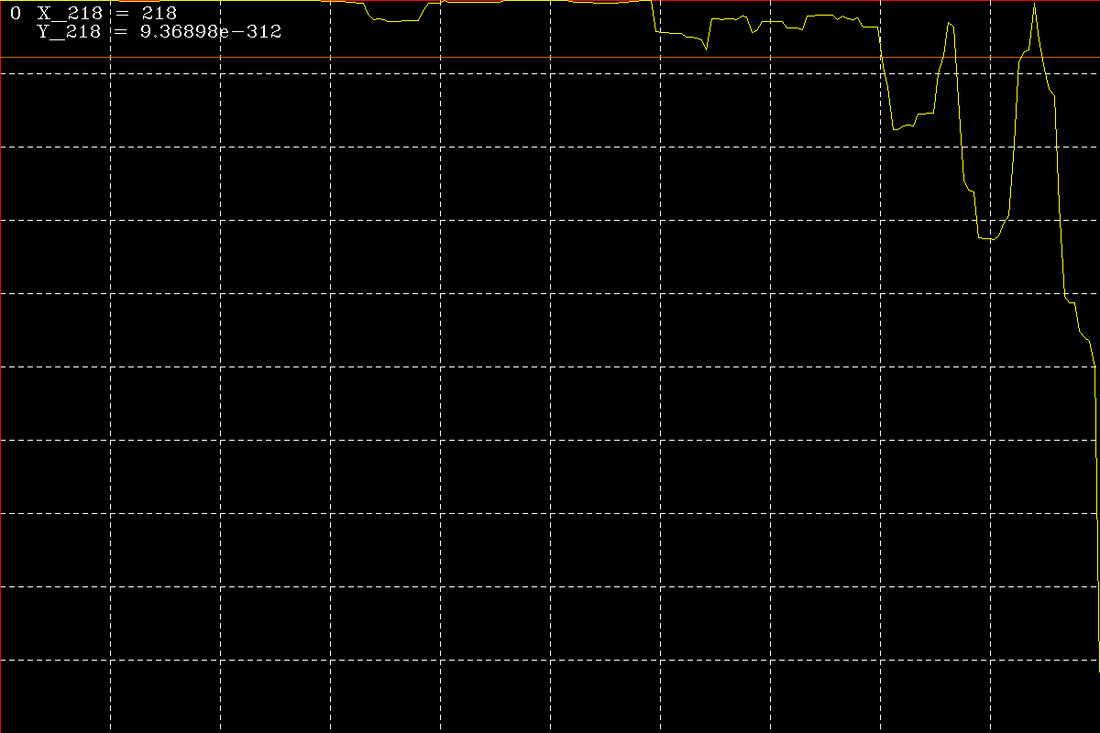
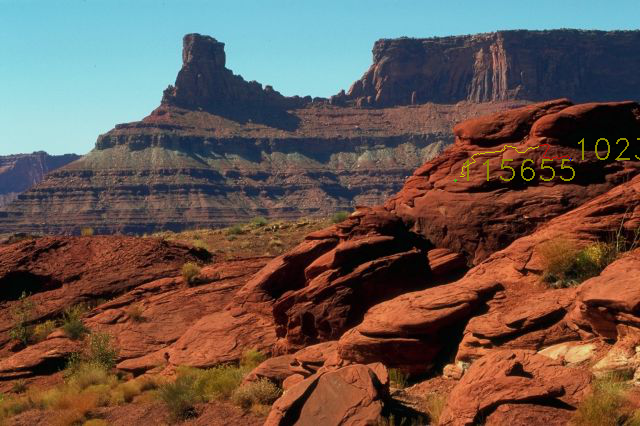
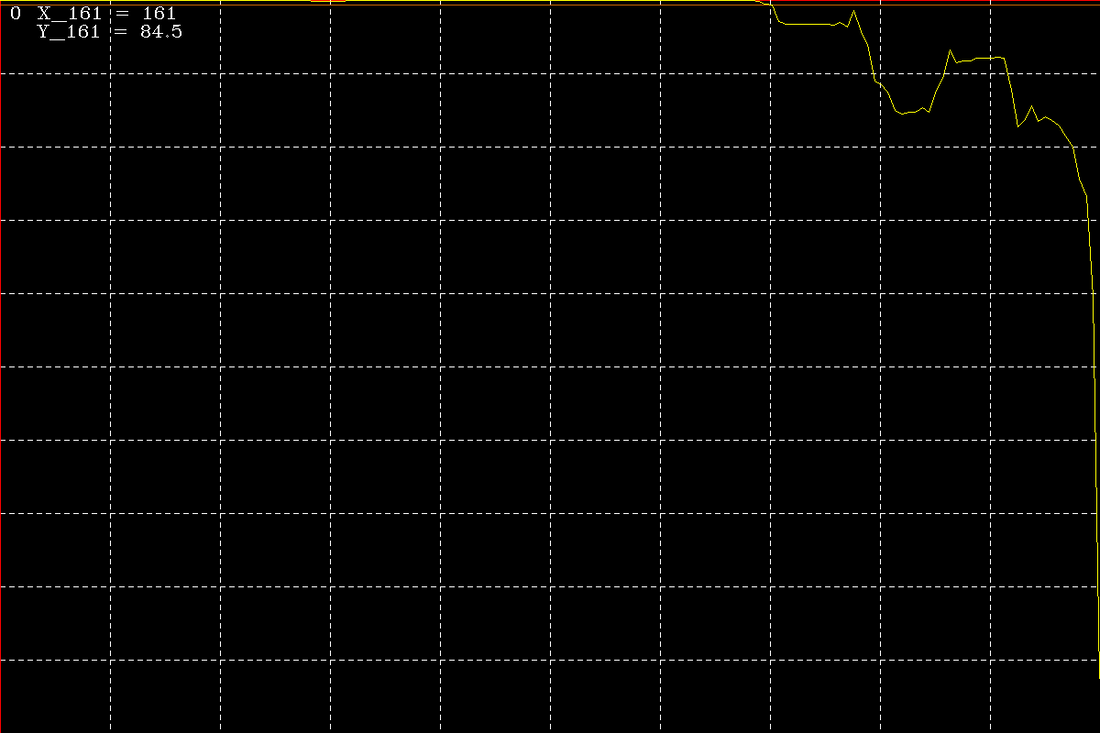
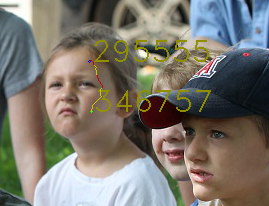
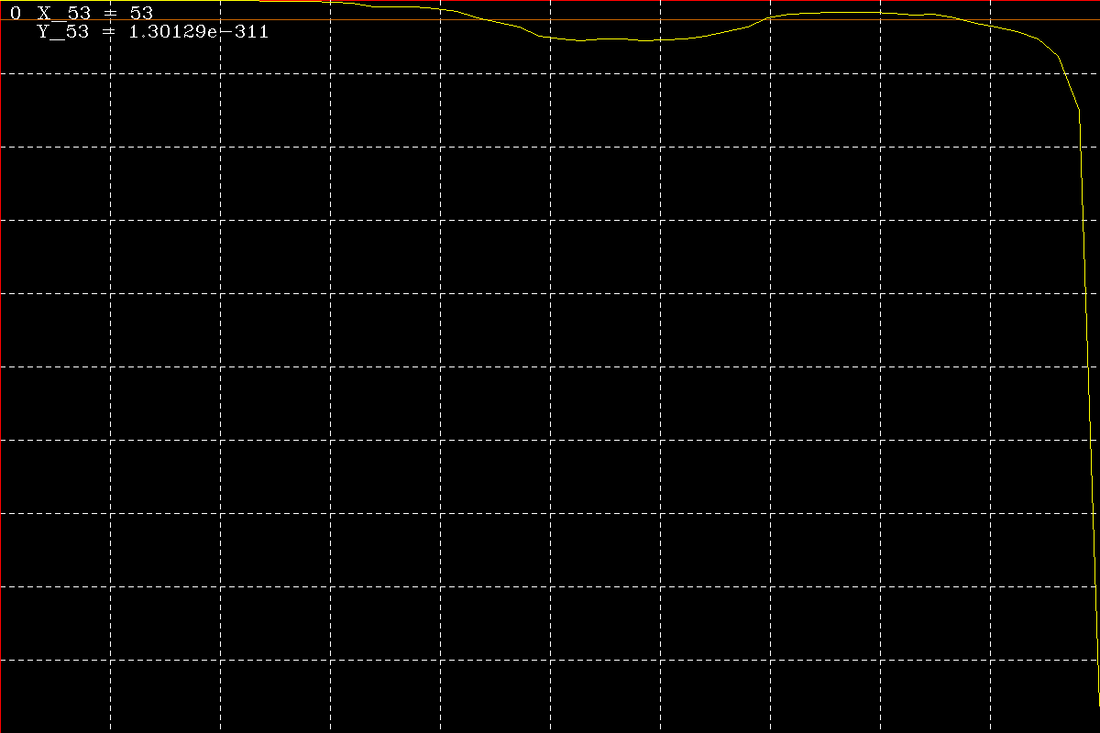
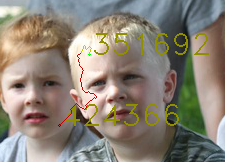
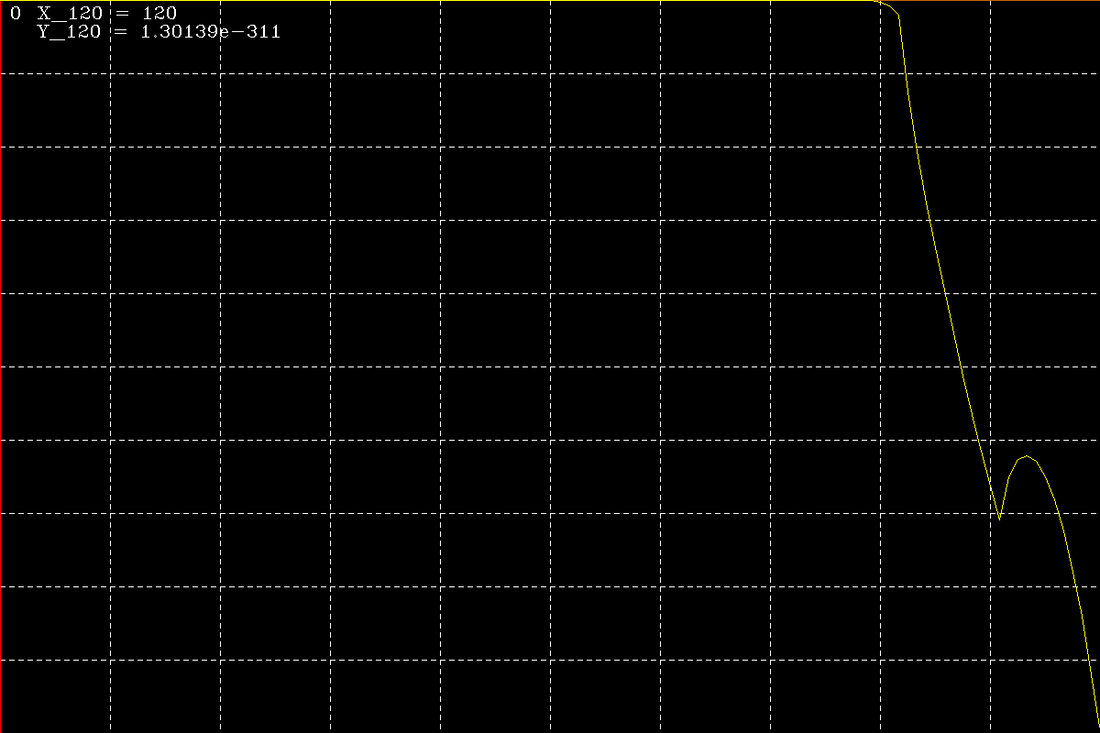
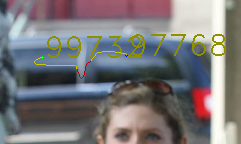
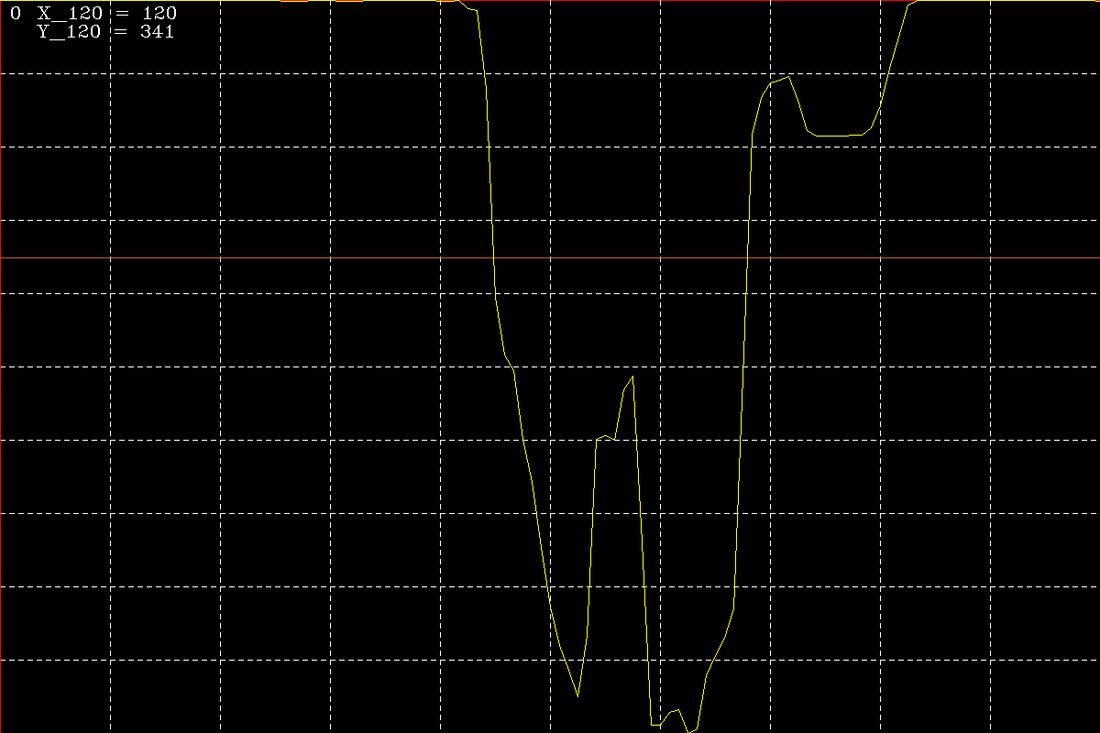
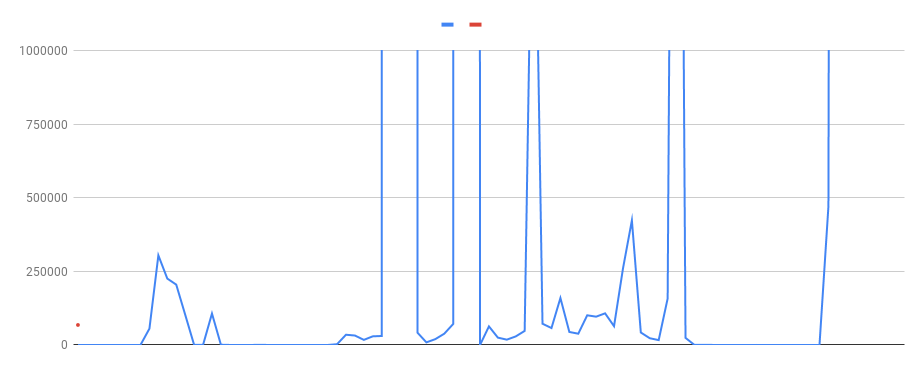
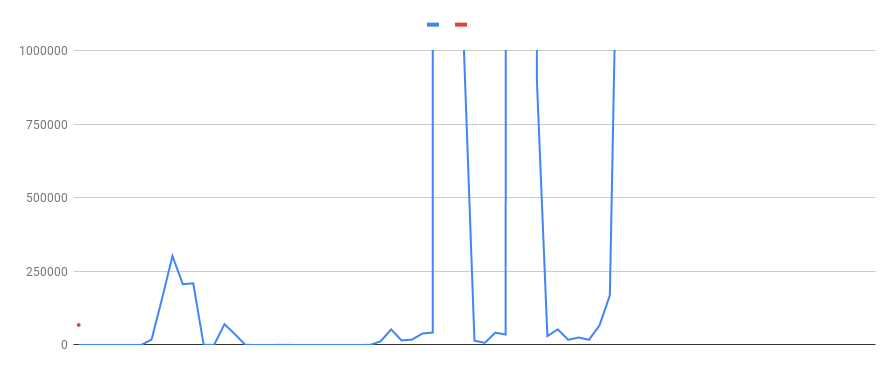
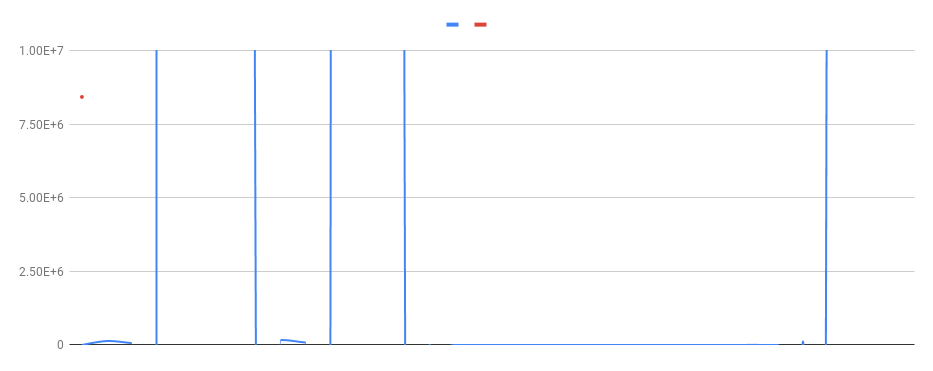
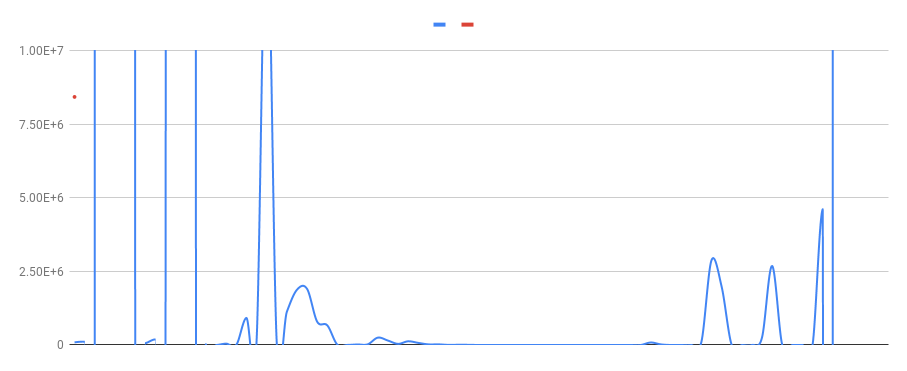
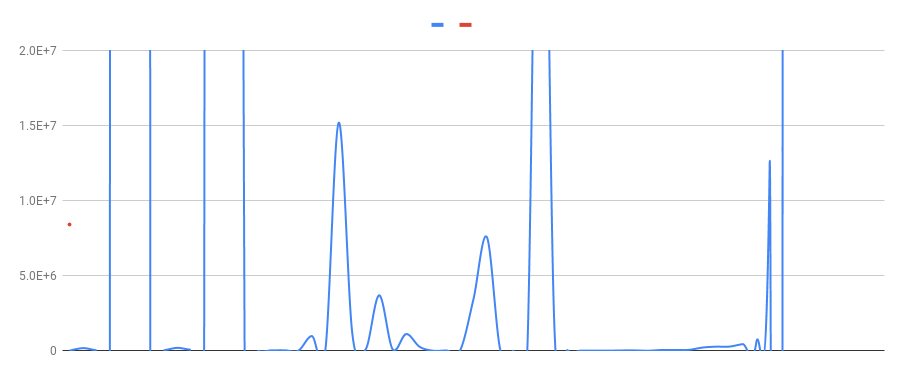
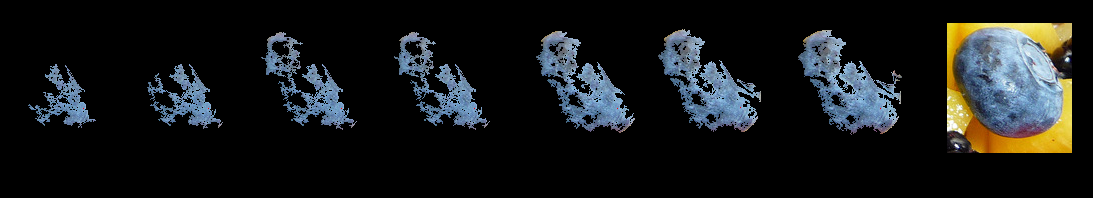
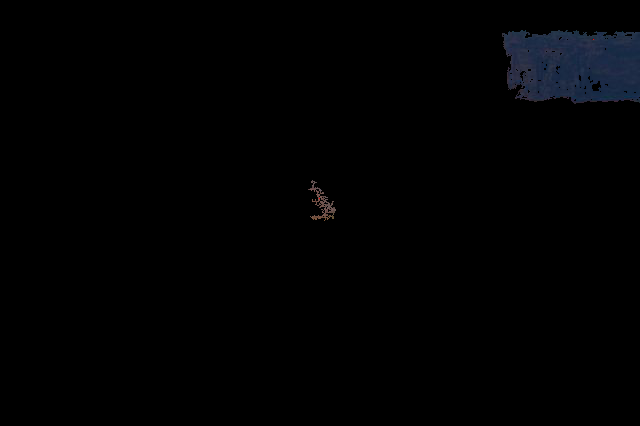
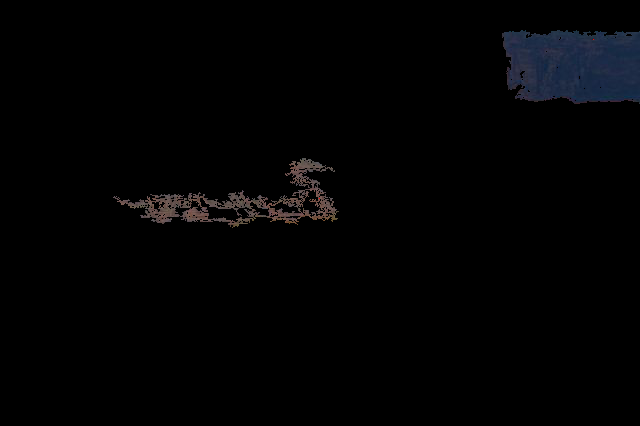
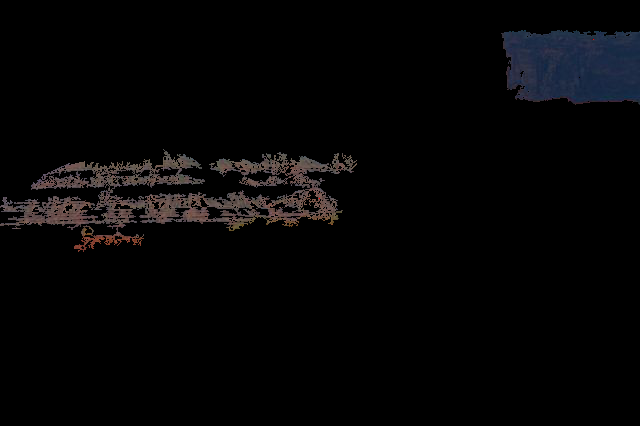
Y-axis: error: difference of (currentpix->dist - hop(10)->dist) X- axis: pixels along the path Red line : 100 x thresh (the axis also shown by red, I noticed this later. so sometimes for small thresholds you can not see the red thresh line since it's overlapped with the x-axis. ) The 0 shows (0,0) of the coordinate. the values are scaled by the graph image dimensions. The paths are shown from a pixel to the selected seed. (we can choose any point as seed and the destination point) I selected the seeds close to the actual ones. In some of the images in last two rows, I changed the path color to red when the error is larger than 100x thresh.
0 Comments
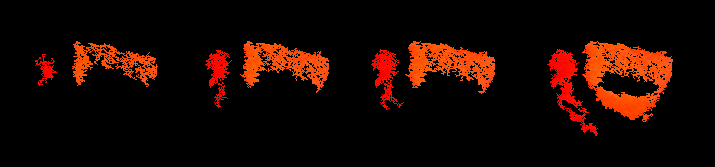
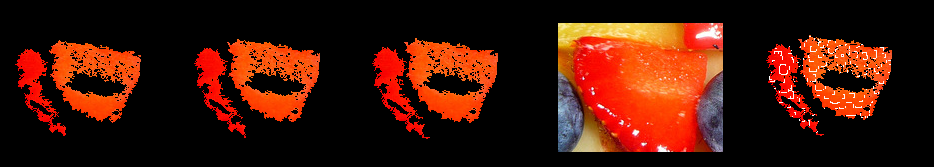
Red dot : 100 x threshold threshold = p-> dist ;//d(10) vertical axis = abs(q->dist- h(10)->dist) // error along the path with jump 10 hops horizontal axis = path to the seed There are seeds that are not growing. The weights of a and b channels are not changed. in fixed region sizesLab colors- in fixed region sizes with different weightsProgressive growth L0.5 ab and Lab |
Categories |


 RSS Feed
